Author: Leah Ma

  • Australia’s EV boom – How insurers need to respond

    The current fuel crisis has materially accelerated Battery Electric Vehicle (EV) adoption in Australia. In March 2026, 16,000 new EVs were delivered, up from around 8,000 a year earlier. EV sales will continue to increase over the coming months. We explore what this means for motor insurers and provide some practical considerations.

    In March 2026, 16,000 new EVs were delivered

    The EV surge

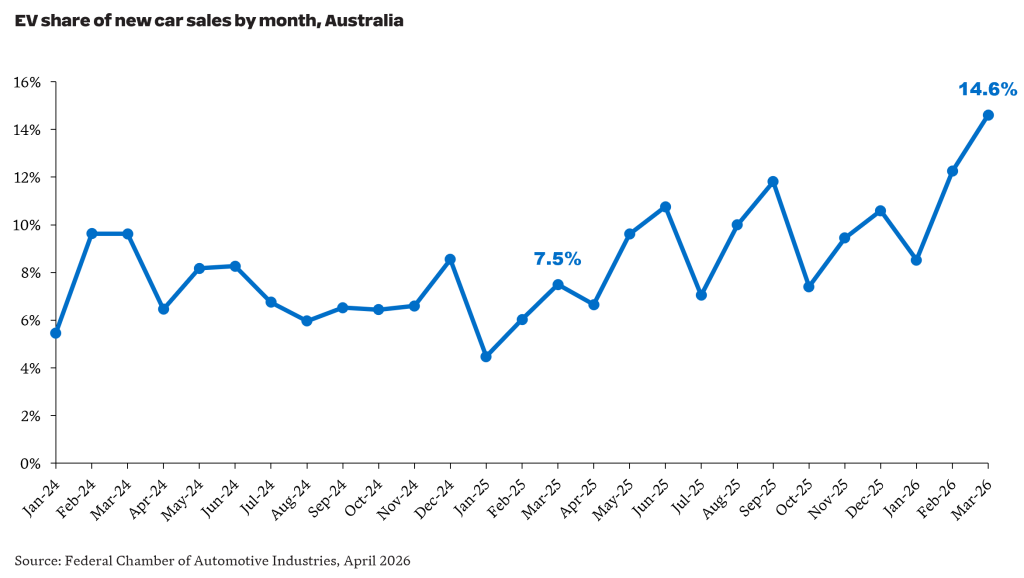
    EV sales as a proportion of all new car sales in Australia reached a new peak of 14.6% in March 2026, up from 7.5% in March 2025.

    New EV car sales reached a peak of 14.6% in March 2026

    The acceleration in EV uptake is unsurprising. Analysis reported in The Australian showed the average cost per kilometre driven is over six times lower for EVs relative to Internal Combustion Engine (ICE) vehicles. For an EV, the cost was around $0.02. For an ICE vehicle, it was closer to $0.14 (excluding utes and large SUVs). The difference highlights the magnitude of the fuel/electricity cost difference.  Of course, this doesn’t provide a complete picture of ownership cost differences. EVs are still on average more expensive than ICEs, but the gap is reducing and is expected to continue decreasing over time.

    Implications for motor portfolios

    While the EV share of motor portfolios is currently small (for example, EVs currently represent around 2% of IAG’s motor portfolio), a structural shift in the fleet composition, will have meaningful consequences for motor insurers.

    A higher claim severity

    EVs attract higher average repair costs than comparable ICE vehicles, due to a combination of:

    • Repairs requiring specialist knowledge which attract higher labour rates and are often restricted to a limited network of authorised centres.
    • Significant total loss exposure – EV battery packs continue to account for a high proportion of vehicle value (currently estimates in the 30%-50% range). Even minor collisions can trigger high repair costs where battery damage is found.
    • EVs are typically equipped with Advanced Driver Assistance Systems (ADAS) and sensor suites, with high replacement and calibration costs.

    A lower accident frequency, perhaps?

    EVs sold tend to include more advanced safety technology than the average ICE vehicle on the road today and should in theory demonstrate a lower claim frequency. However, reports to date have been mixed. An analysis by Parmar and Woods (2025) of data from Norway reported a 17% lower accident frequency overall for EVs compared to ICE vehicles. This study focused on passenger vehicles and found EV frequency to be lower across most dimensions (e.g. type of accident, road type, speed limits, weather), but higher frequency in certain scenarios (e.g. pedestrian accidents and rear-end collisions).

    How should insurers respond?

    EV claims inflation is outpacing ICE vehicles due to battery costs and limited repair networks. As EV volumes grow, engaging with repairers early to ensure access to a sufficient network of certified repairers will be an important lever to managing claims cost.

    How do EV and ICE premiums compare?

    EVs typically cost more to insure than comparable ICE vehicles. Part of the reason is EVs tend to be more expensive than comparable ICE vehicles. However, this is only part of the story.

    We’ve analysed quotes from NRMA, QBE and AAMI for three common ICE vehicles and three EVs with similar vehicle values. Our market scan showed each insurer offered a higher price for the EV relative to the comparable ICE variant – with the difference ranging from +0% to +39%.  We also found a higher variation in premiums for EVs. For example, for the BYD Atto 3, we found a $900 difference between the cheapest and the most expensive premium. For the petrol Mazda CX-30, the difference was $500.

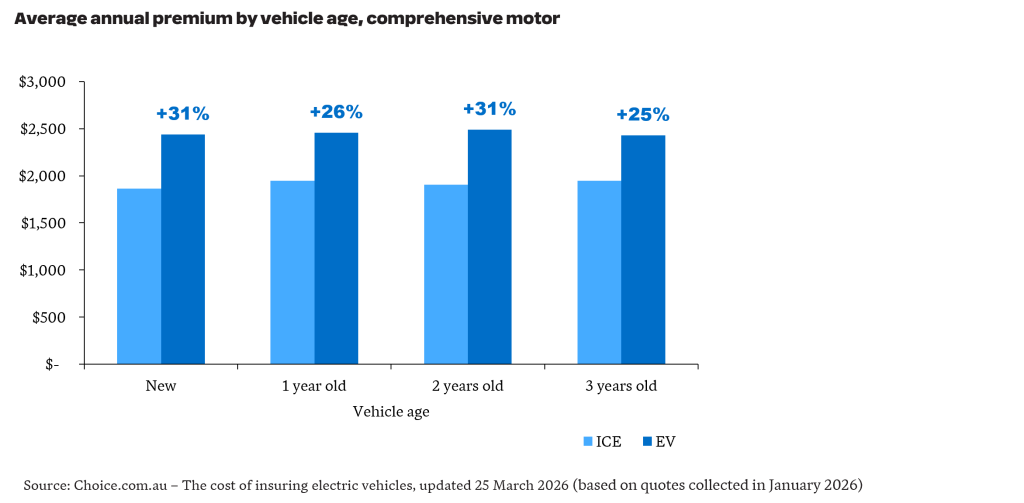
    These results align with analysis by choice.com.au which compared the average annual comprehensive motor premium across 16,000 EVs and 36,000 ICE vehicles – showing EVs were up to 31% more expensive.

    Insurance for EVs were up to 31% more expensive

    What insurers need to monitor to stay ahead

    The fuel crisis may have done more than shift consumer behaviour in the short term – it may have pulled forward Australia’s EV transition by several years.

    For motor insurers, the portfolio implications will compound over time and the developments warrant active monitoring. The major changes will be:

    1. Fleet composition drift – As EV penetration rises, the mix of vehicles on risk will continue to shift towards EVs. Insurers will need to consider the impact of changes in brand mix with several new manufacturers with little local claims history entering the market. Over the short to medium term, with the accumulation of local EV claims experience, insurers should be better placed to validate and revise assumptions currently embedded in their pricing – replacing assumptions informed by experience overseas or using non-EV proxies.
    2. Repairer costs and network expansion – The current higher EV repair costs is in part a product of repairer scarcity and parts supply immaturity. As the repair ecosystem develops, average EV claims costs should moderate – however the pace of this development is highly uncertain. Pricing models should be updated as experience emerges to maintain competitiveness and at the same time ensure pricing remains adequate.
    3. Government initiatives – EV uptake is materially impacted by government initiatives – in Germany, the US and China, material reductions in EV sales were observed following roll-back or removal of subsidies. For Australia, there is uncertainty around potential scaling back of the Fringe Benefits Tax exemption for EVs, at least until the May 2026 Budget. State government initiatives, such as the 2026 update to the NSW Electric Vehicle Strategy which includes extension of electrification incentives to commercial vehicles, training initiatives for EV mechanics and commitment of $100M to expand charging infrastructure, should accelerate EV adoption.

    The fuel crisis may do more than temporarily alter driving behaviour. It could accelerate a lasting shift in Australia’s vehicle mix, bringing forward the transition to electric vehicles and reshaping motor portfolios sooner than many insurers expected. As EV exposure grows, insurers that respond early will be better placed to protect margins and retain market share.

  • Key trends in quantitative evaluation for Government

    Clear evidence about outcomes underpins sound policy and funding decisions, yet generating that evidence is rarely straightforward. Choices about data and evaluation design shape what conclusions are possible, particularly when trying to understand impact and why programs do (or don’t) work for different groups. Drawing on a decade of experience, Hugh Miller reflects on how quantitative evaluation has matured to better allow government to understand impact.

    Recently, I had the opportunity to present some thoughts on how evaluation has changed over the past decade, with an emphasis on the quantitative analysis we specialise in. My main thoughts are summarised below, and have implications for most areas of government.

    I also recognise many of the items below partly reflect my growth as an evaluator as much as broader changes in the space.

    Enduring data linkages are changing how governments evaluate impact.

    Data linkage has been a key part of the evaluation landscape for the past decade or so, since it enables us to look beyond what is in the specific program data. For instance, we can track across time (e.g. do people using a mental health program re-access services afterwards?), across services (how frequently do they present to hospitals with mental health issues?), and can be used to make broader comparisons (how do service patterns compare to similar people who did not access the program?).

    Many of our past evaluations have involved bespoke linkages, where a specific set of administrative and program data would be linked together for a specific cohort. This added significant time and effort to the analysis. In some cases, this was also duplicative and wasteful – we would see the same people and datasets linked multiple times for different projects.

    A much better solution is to have regular enduring linkages that can be accessed for specific projects. Governance and privacy provisions remain strong, but it avoids the delay associated with linkage and removes the duplication.

    Examples of these national and state-based assets include:

    Despite this progress, significant work remains. An obvious challenge in Australia remains the gap between State and Territory datasets and the Commonwealth – sharing and governing data for linkage remains complex, and inhibits work in areas of shared responsibility, which include health, education and disability.

    We’ve built a lot of models based on administrative data for government, and most carry the well-worn disclaimer that ‘correlation does not imply causation’. The reluctance to attempt to get at questions of causation often reflects a proper assessment of what is possible with the data, but is unsatisfying for policymakers who want to understand how a program or policy is affecting people.

    We have seen something of a causal revolution in the past two decades, with much theoretical and applied work occurring in statistics and econometrics to explore new methods and the circumstances where causation is reasonable (see for instance Pearl, 2009 or Imbens & Rubin, 2015*). These causal methods are increasingly popular, particularly in economics.

    I think this push is mostly positive – it is useful to have researchers think deeply on questions of cause, and what assumptions need to hold for results to be causal. It is also useful to have a variety of tools available to explore these questions when the right data presents. And it has encouraged researchers to be on the lookout for natural experiments that can create the insights we seek.

    There is always a question of whether the pendulum has swung too far, and in some cases this is definitely true. There are definitely pieces of work where the word ‘causal’ is now added because of an analytic technique where the underlying data warrants far more caution due to confounding factors or selection effects. But we are in a better place with our larger toolkit.

    One area I’ve particularly enjoyed is thinking carefully in the design stage of an evaluation to understand whether there are clever ways to exploit the data to ask more strategic questions.

    As an example, consider health interventions designed to help people regularly take their medication. A straight linkage between the program and an outcome such as hospital presentations would be unlikely to reveal much – we might actually see that people who take more medication go to hospital more (since their starting health may be worse). However, a more targeted approach that looks at outcomes for people hospitalised with a specific condition, then given a post-hospital medication regimen, allows for more controlled program and comparison group analysis, including whether there are subsequent re-admissions. In this case, we throw a lot of data away (by focusing on specific sub-cohorts and hospital presentations) but end up with a much more meaningful test.

    In a world with more linkage and larger datasets, the opportunity to be targeted and creative in the outcomes we measure is larger.

    Again, challenges remain, with some areas remaining difficult to convert into unambiguous meaningful outcomes. For example, mental health services remain difficult to evaluate, even with good linkage – a person no longer accessing MH services might indicate a good recovery, or an ongoing need that is no longer being met – and so it is hard to distinguish between the two.

    Evaluations often include an economic component, seeking to understand if the service offers good value for money, which in turn can inform program design and future funding.

    Historically economic analyses vary widely – particularly in the value placed on outcomes. For example, the value of successfully helping someone into employment will vary by factors such as the timeframe of employment assumed, whether government and/or private benefits are recognised, and how the opportunity cost of time while employed is recognised. This variation can be partly resolved by good transparency in reporting and greater use of standardised benefits to ensure consistency.

    A more fundamental source of variation is the degree to which assumptions (whether drawn from broader evidence or plausibly guessed) are used compared to numbers tied to quantitative outcomes. At worst, this creates unhelpful estimates that are not grounded in reality. My all-time least favourite economic analysis of a government program took estimated fiscal multipliers from international health programs and assumed that was a reasonable estimate of the benefit-to-cost ratio of the program, which means that you get large benefits irrespective of whether any actual value is delivered.

    Encouragingly, there is growing expectation that economic benefit estimates are meaningfully tied to outcome benefits. This can be challenging when funding cycles are short and when evidence is still emerging, but adding rigour and discipline will ultimately lead to better articulation of what a program is achieving.

    I’m ultimately optimistic about where evaluation is heading. Today, expectations are higher: evaluations are more likely to focus on measurable outcomes and explore impact. This shift means evaluation is better serving the need to inform funding and policy choices. This raises the bar for all of us – not just to produce analysis, but to be clear about what programs are achieving, for whom, and why.

    *Pearl, J. (2009). Causality. Cambridge university press and Imbens, G. W., & Rubin, D. B. (2015)Causal inference in statistics, social, and biomedical sciences. Cambridge university press.

  • Iran conflict fuelling compounding risks for Australian insurers

    The 2026 Iran conflict is reshaping the risk outlook for Australian general insurers. Pressures that are usually analysed separately are now converging, compounding an affordability crisis at least five years in the making with effects likely to outlive the conflict itself. As volatility becomes the new norm, understanding and adapting to this new risk landscape will determine who thrives.

    For many Australian households, insurance has now become one of the largest non‑discretionary expenses – home premiums are up almost 70%*, 15% of households are in affordability stress, the RBA has hiked rates twice in 2026 already, and heightened claims inflation will likely outlast the conflict.  For insurers, that pressure no longer sits only in claims costs. It is reshaping demand, investment risk, capital adequacy and portfolio composition at the same time.

    Separate pressures are converging, reshaping risk and compounding affordability challenges.

    The 2026 Iran conflict is escalating these pressures through three risk channels simultaneously:

    • An energy and supply chain shock driving broad-based claims inflation
    • Macro and financial market stress impairing investment returns
    • Conflict activity – vessel attacks, airspace closures, cyber threats and proxy operations – generating elevated risk exposures across specialty lines and beyond.

    The real challenge for Australian insurers lies not just in tackling each risk on its own, but in managing the combined impact. Insurer success now hinges on recognising how these risks are interconnected and adapting strategies for a world where volatility is the new norm.

    So, what does this mean for general insurers in practice? We examine how each risk channel is affecting the industry and outline the actions insurers must take to navigate the rapidly changing landscape.

    The conflict flows through three risk channels – each generating distinct impacts on Australian general insurers. The figure illustrates the interplay between these risks and the impacts on general insurers.

    Interaction of risks between the Iran conflict and Australian general insurers

    Now we explore how each of these risks translates into impacts on general insurers in more detail.

    Australian general insurers are facing widespread claims inflation. Australian petrol prices rose around 70 cents per litre to their peak in March with the government’s temporary excise halving clawed back approximately 26 cents, but prices remain around 40 cents above pre-conflict levels. Diesel has climbed above $3 per litre, with the divergence particularly acute for transport, farming, and construction.

    Supply chain disruption adds a second layer. Freight surcharges have been in place since early March, and disruption to global shipping routes is flowing through to the cost of goods underpinning claims – vehicle parts, building materials, plant and equipment. Preliminary ICA data shows cost increases of up to 36% for building materials, 30% for trades and on-site specialists, and 50% for freight.

    The result is broad-based claims cost pressure across almost all classes, driving up average claim sizes and, in turn, premiums.

    Rising energy and supply chain costs are pushing up claims inflation – and the RBA is responding with rate hikes. Higher rates reduce the market value of fixed interest securities. Interest bearing securities comprise over 80% of direct insurer assets* and over 95% of reinsurer assets*. Where duration matching is sound, falling bond values are offset by a corresponding fall in the present value of liabilities but this only addresses the discount rate effect. Claims inflation independently increases the nominal value of future liability cash flows, pressuring the balance sheet from both sides. Inflation-linked bonds offer a partial hedge in principle but limited market depth constrains their use at scale – and CPI may not move in sync with the specific cost pressures driving claims inflation in motor, property, and other lines.

    Beyond liability-backing assets, surplus capital deployed in fixed income or equities has no natural hedge. The ASX fell more than 7% through March. For direct insurers with meaningful equity exposure, the capital impact is even more significant.

    Direct exposure to conflict-sensitive specialty classes for Australian general insurers is limited, with globally mobile risks – including international marine hull, airline aviation war and allied perils, and political violence – largely placed through the London market.

    Impacts are more likely to be indirect. In cyber, the conflict is contributing to an elevated global threat environment, including increased state-linked activity, with potential implications for underwriting and losses. The macroeconomic spillover is also elevating risk in other lines – most notably LMI – where inflation and a tightening RBA bias are weighing on housing demand, with clearance rates at multi-year lows and employment expected to soften.

    Affordability pressure is reshaping customer behaviour across the market in four ways.

    BehaviourCustomer actionInsurer impact
    LapseCancel cover entirely – over 340,000 homes already uninsured, around half citing cost (Australia Institute, 2025)Premium volume falls; portfolio risk composition may shift as customer mix changes
    UnderinsuranceReduce sum insured to lower premium – over 530,000 households already underinsured (Australia Institute, 2025)Shortfall disputes and reputational damage at point of claim
    Product substitutionMigrate to narrower, lower-cost coversRevenue mix deteriorates; coverage adequacy falls across the portfolio
    Active shoppingIncrease comparison activity and churnMargins erode; acquisition costs rise

    Premium affordability and insurability has risen from the sixth most commonly reported business challenge in 2025 to the first in 2026.

         Gallagher Bassett Carrier Perspective: 2026 Claims Insights sneak peek

    The conflict is forcing a fundamental reset across planning, capital and operations. Across the industry, five clear priorities are emerging in response.

    Looking Ahead

    Structural shocks that generate correlated, simultaneous pressure across claims, assets, and demand are not a one-off feature of 2026 – they are an increasingly consistent feature of the risk environment. This time it was Hormuz and energy, next time it could be another regional conflict disrupting technology supply chains, a major climate event tightening reinsurance capacity, or something else entirely. The challenge is not predicting the next crisis, it is building the infrastructure and processes to respond rapidly when the next trigger arrives. These include scenario frameworks that can be reoriented quickly, assumptions built to be updated rather than anchored to history, and capital and portfolio positions that are monitored against a range of outcomes. Insurers who invest in this capability now will be better placed to navigate whatever comes next.

    * Based on Taylor Fry’s analysis using the Australian Prudential Regulation Authority’s quarterly general insurance performance statistics for December 2025.
    ** https://www.fcai.com.au/evs-surge-as-buyers-respond-to-fuel-uncertainty/

  • Media release – Taylor Fry wins Best Public Sector Evaluation

    Media release – Taylor Fry wins Best Public Sector Evaluation

    The Australian Evaluation Society awarded our team, along with our partner ARTD Consultants, for their large mixed-method study centred on suicide prevention. Working with NSW Health, we evaluated six new initiatives that were part of the Government’s Towards Zero Suicides suite.

    The Best Public Sector Evaluation recognises “exemplary evaluation work conducted within the Australasian public sector that has been used to effect real and observable changes in policies or programs”. Led by Hugh MillerRamona Meyricke and Dennis Lam, the resulting report linked state and Commonwealth data, offering a rare system-wide view of suicide prevention efforts in NSW.

    Hugh Miller accepting the award at the AES event and after the win, with Dennis Lam

    The six programs evaluated form part of the NSW Ministry of Health’s Towards Zero Suicides initiatives – a $2.9 billion, multi-year investment in mental health services. The Australian Evaluation Society (AES) said the work “strongly demonstrated change and contribution to knowledge at a broad scale”, including “practical tools and frameworks [to] guide future evaluation practice”. Our report was strengthened, it said, by the embedded nature of diverse experts, such as an Indigenous reference group and people with lived experience.

    On accepting the award on behalf of Taylor Fry, Hugh said, “It was a long and sometimes challenging project but we delivered something pretty special. I’m particularly proud of the use of longitudinal linked data, as a way of understanding what happens to people before and after accessing a service or program, crucially important in this space.”

    He said the evaluation also demonstrates that suicide prevention is everybody’s business. “More than half of the people who die by suicide do not have a suicide-related or mental health interaction with Commonwealth or state health systems in the year prior to death. This means that achieving large reductions in deaths also requires investment in strengthening our communities, looking out for the vulnerable and isolated, and ensuring our non-health government services are run in ways that are not harmful. Tough but worthy work.”

    For a summary of the evaluation, view our article, NSW Ministry of Health releases Taylor Fry report.

    Read the report in full – the overarching report Evaluation of Suicide Prevention Initiatives or the brief  Summary Report.

    Visit the Australian Evaluation Society for more on the Best Public Sector Evaluation Award.

  • RADAR FY2025 – Balance and meaningful action vital amid huge wins

    RADAR FY2025 – Balance and meaningful action vital amid huge wins

    What are the big themes for insurers following another year of record-breaking profits? In RADAR FY2025, Taylor Fry offers key insights on how to navigate the shifting landscape, with its greater focus on transparency and customer experience, increasing AI adoption and the ever-present risks of an evolving climate.

    The general insurance industry has again posted its strongest result in more than 10 years with a profit after tax of $7.3 billion over the 12 months to 30 June 2025, according to recent data from the Australian Prudential Regulatory Authority (APRA).

    While we expect the escalating figures will intensify focus on pricing practices and fairness, we stress the importance of perspective through a long-term view in our latest class-by-class analysis of the sector, RADAR FY2025.

    Dive into RADAR FY2025 for a raft of expert analysis, reader-friendly charts and insightful videos covering the major happenings, emerging trends and impacts for insurers.

    Here’s an overview of some of the key themes you’ll find at our RADAR FY2025 hub …

    Volatility vs the long-term view

    “Understandably, consumers may question the big result in a time of ongoing cost-of-living and insurance affordability pressures,” principal Scott Duncan says. “But insurance is naturally a volatile business year on year and it’s critical not to view profits solely from a one-year window. Insurers were hit particularly hard during COVID.”

    This experience is reflected in the share price of the larger insurers. “The share price for Suncorp, IAG and QBE have increased at twice the rate of the broader market since 2020. Yet when we take a longer-term view, over the past 10 years, we see their share price has matched the broader market.”

    Scott says this short-term volatility but steadier, long-term picture demonstrates the core role of insurance. “Insurance acts as a shock absorber for households and the broader economy to ensure the sector can restore community when times are bad.”

    Opportunities for the taking

    A run of positive experience over the past two years, however, provides the industry with vital opportunities to reflect and invest purposefully in better serving customers. “Previously, insurers reported years of muted returns through extreme weather events and COVID-19, with sustained losses in the householders class,” he says. “Supported by robust bottom lines, investing in customer relationships now will be the defining strategy to secure long-term trust and loyalty.”

    “Investing in customer relationships now will [lead to] to long-term trust and loyalty.”

    The response to Cyclone Alfred, Scott says, is a good example of a customer-first approach. “Insurers provided specialist response teams, which resulted in faster claims handling and improved communication with customers.”

    The industry is also investing heavily in AI to improve underwriting and claims processes. “We’re seeing claims assistants summarising product disclosure statements and recommending next best steps for claims managers,” Scott says. “On the underwriting side, AI is being used to obtain relevant information, reducing the information collected from customers.”

    What’s driving the big result

    Looking at the figures, RADAR FY2025 shows direct insurers recorded a $6.7 billion profit after tax, the highest on record, driven by several factors, including catastrophic losses coming in below expectations, several years of double-digit premium increases, strong investment returns and reserve releases.

    Insurers will need to place the customer at the centre of proactive initiatives … to help foster policyholder loyalty and confidence in their insurer to do the right thing when it counts the most.

    Scott draws out householders, domestic motor and a softening market as key highlights across the underwriting result. “While householders recorded an insurance service result of $1.16 billion – the strongest in more than 10 years – APRA data shows a continued decline in risks written over 2025, with evidence that consumers who retain insurance are increasing excesses to offset cost-of-living pressures,” he says.

    Signs of a softening market

    With strong signs of a softening market, balancing growth and profitability objectives in the near term will be challenging. “Insurers will need to place the customer at the centre of proactive initiatives, such as focusing on a seamless acquisition journey or ensuring people are not left with inadequate cover.

    “These types of moves will help to foster policyholder loyalty and confidence in their insurer to do the right thing when it counts the most.”

    For reinsurers, who recorded a $0.6 billion profit after tax – the second highest in the past 10 years – the market is also softening, Scott says. “The pricing and risk selection discipline shown over the past few years will come under challenge.”

    Climate and extreme weather

    With access, affordability and transparency in the spotlight, climate issues, as ever, are adding extra pressure. Scott says, “The recently released National Climate Risk Assessment confirms Australians will continue to experience climate hazards with widespread, cascading and compounding impacts that will reshape risk and influence insurer profitability.”

    The National Climate Risk Assessment confirms climate hazards will reshape risk and insurer profits

    Additionally, new technologies and business practices relating to the energy transition will further redefine risk and profitability. “Australia has set records in 2025 in terms of battery storage growth, electric vehicle sales and installed solar power capacity, presenting relatively new risks to the industry.” More risks will emerge as the energy transition progresses, Scott adds, which increases the importance of underwriting decisions and portfolio risk monitoring across many classes of business.

    Eye on the future

    Scott believes pricing transparency will be high on the agenda ahead, as demonstrated by ASIC’s recent focus on how insurers communicate year-on-year changes in premiums to their customers. “Insurers can take action now to improve fairness and transparency, such as giving home insurance policyholders premium reductions for actions they take to improve a property’s resilience.”

    AI adoption at pace will continue for some time, as insurers aim for quicker and more consistent outcomes for customers. “The focus is now switching to AI governance, data security and cyber risk management,” he says. “The more agile insurers will not only protect customers with appropriate guardrails but ensure fair treatment. Empathy and critical thinking are crucial here, especially for the most vulnerable customers.

    “Taking time now to reflect on how to elevate customers’ experience, truly understand their needs and take proactive steps to build more trust will be critical in securing a strong foundation for the future.”

    For more details, or to arrange an interview with Scott Duncan, please contact:

    Elizabeth Finch | +61 473 848 888

  • NSW Ministry of Health releases Taylor Fry report

    NSW Ministry of Health releases Taylor Fry report

    We evaluated a suite of NSW Government suicide* prevention initiatives, which form part of the state’s $2.9 billion investment in mental health services. By linking state and Commonwealth data, our evaluation offers a rare, system-wide view of suicide prevention efforts in NSW – revealing positive impacts as well as opportunities to improve health responses and community resilience.

    The NSW Ministry of Health recently published our evaluation of six programs under the state’s Towards Zero Suicides initiatives – a multi-year effort to reduce suicide and its devastating impact on individuals, families and communities.

    Led by Taylor Fry’s Hugh Miller, Ramona Meyricke and Dennis Lam in collaboration with ARTD Consultants, the evaluation brings together a diverse mix of evidence – including linked administrative data, interviews with stakeholders and consumers, surveys and program-level data – to understand how the initiatives are operating and where they can be strengthened.

    The six initiatives span the full spectrum of suicide prevention supports:

    • Safe Havens
    • Suicide Prevention Outreach Teams
    • Zero Suicides in Care
    • Community Gatekeeper Training
    • Post Suicide Support
    • am/ Youth Aftercare.
    The initiatives reach those who weren’t accessing support or who otherwise wouldn’t have reached out

    Initiatives critical in connecting people

    Our evaluation found the initiatives are reaching thousands of people across NSW – including those who may not otherwise have sought support. In some districts, more than 40 per cent of Safe Haven visitors reported they would not have sought help had the service not been available. This highlights the critical role these initiatives play in connecting with people who may fall through the gaps in traditional care pathways.

    Linked data key in understanding patterns of service use

    A key strength of the evaluation was the use of linked administrative data across NSW Health and Commonwealth systems – including emergency, inpatient, mental health, MBS and PBS records. This enabled a more complete view of service pathways before and after engagement with the initiatives, and broader patterns of service use prior to self-harm or suicide. For example, the evaluation found only one-third of people who died by suicide had a recorded interaction with NSW Health mental health services in the year prior to their death. These insights are helping to build a clearer picture of where the system is working well – and where there are opportunities to strengthen access, coordination and follow-up care.

    Positive outcomes and service gaps

    In terms of outcomes, consumers reported high satisfaction and reduced distress, particularly those accessing Safe Havens, Youth Aftercare and Post Suicide Support. In some districts, Safe Havens were also associated with fewer emergency department presentations for suicidal ideation. At the same time, the evaluation identified important service gaps – and opportunities to improve data capture, referral pathways and access for priority groups, including older people, men and LGBTQIA+ communities.

    For more details, read the overarching report Evaluation of Suicide Prevention Initiatives, or the brief  Summary Report.

    *The pain and loss of suicide for those who take their lives and the loved ones they leave behind affect thousands of people each year in Australia. If this article raises concerns for you, please contact Beyond Blue on 1300 22 4626, Lifeline on 13 11 14 or seek help from these crisis helplines and support services.

  • When the heat is on: Where Australia’s workers face greatest risk

    As temperatures rise and heatwaves become more frequent, workplaces need to determine the risk of heat for their workers. Taylor Fry has developed the Heat-Related Workforce Injury Risk Index to provide a nationally consistent, region-level view of where extreme heat is most likely to translate into workplace injury risk across Australia. We reveal early results including which regions pose the highest risk and why.

    In Australia, roughly 3,000 workers become ill or are injured at work every year due to heat, and that’s likely a significant undercount.

    Australia has warmed every decade since the 1950s with extreme heat events becoming more frequent and intense. These conditions are projected to increase the incidence of heat-related illness and injury in occupational settings.

    At the same time, heat is rising on the labour and workplace safety agenda around the world. Unions and health bodies are calling for stronger, clearer protections for workers against extreme heat. Regulators are reinforcing employer obligations to manage heat risk under existing WHS frameworks.

    The direction of travel is clear: heat is a growing workplace hazard in Australia. For workers’ compensation schemes, self-insurers and regulators, this raises important questions:

    • Where is heat most likely to drive increased claim frequency?
    • Which regions and industries face structurally higher exposure?
    • How might rising temperatures affect scheme sustainability over time?
    • Where should prevention efforts be prioritised?

    To help answer these questions, we developed the Heat-Related Workforce Injury Risk Index.

    The index is a nationally consistent, region-level tool that maps where climatic heat stress and workforce exposure intersect to create elevated injury risk.

    The index brings together three components:

    1. Hazard – How often local conditions exceed safe working heat thresholds

    We measure heat stress using Wet Bulb Globe Temperature (WBGT), the internationally recognised standard for occupational heat stress used by occupational health and safety experts globally. WBGT combines air temperature and humidity (as well as wind speed and solar radiation) to reflect how effectively the human body can cool itself through sweating. This is incorporated using BoM daily weather data.

    2. Exposure – How many people are working in heat-exposed industries in that region

    This is measured using “place of work” data, allowing us to map the daytime distribution of workers across industries and regions.

    3. Vulnerability – The baseline injury risk profile of workers in each industry

    Vulnerability reflects differences in underlying injury rates across industries, using national workers’ compensation data

    Who is feeling the heat?

    Heat risk is not evenly distributed across Australia.

    While most SA2 (Statistical Area Level 2) regions record low to moderate index values, a small number stand out dramatically – several  regions record values more than 40x higher than the national median. These are areas where three factors converge:

    • Prolonged periods of high WBGT are common
    • Large concentrations of workers are employed in physically demanding or heat-exposed roles
    • Baseline injury rates are already elevated.

    The highest-risk region is East Pilbara in Western Australia. This region records around 200 days a year above the WBGT threshold, according to BoM data, and supports one of Australia’s largest mining workforces. Many workers are on a fly-in fly-out basis and may arrive from cooler climates, meaning they are often not fully acclimatised to local conditions, which heightens physiological strain.

    Importantly, heat risk is not confined to remote regions that are traditionally associated with extreme temperatures. Industrial precincts on the edges of major cities also feature prominently.

    For example, Rocklea–Acacia Ridge located within Brisbane’s industrial corridor has a dense concentration of transport, warehousing, logistics and manufacturing operations. High humidity, which is a critical driver of WBGT, combined with a large high-risk workforce materially increases exposure.

    Other very high risk areas include:

    • Brisbane Airport: Airport operations involve extensive outdoor or semi-outdoor activity on metal surfaces and large paved areas that radiate heat. Physical tasks such as baggage handling, ground operations and maintenance become significantly more demanding on high-WBGT days. In addition, workers are often required to wear high-visibility and specialised PPE, such as anti-static garments used around aviation fuels and oils, which are not always conducive to ventilation and cooling.
    • Brisbane City: Even in a metropolitan CBD environment, workforce density and climate exposure can combine to produce elevated risk. Heat risk is not only about remote mine sites. It is also about how many people are working, what they are doing, and how often conditions exceed safe thresholds.
    Top four SA2 regions with the highest Heat-Related Workforce Injury Risk Index

    These results show heat risk extends beyond specific sectors, regions, or occupational groups traditionally associated with extreme temperatures. Developing a more nuanced and granular understanding of who, where, and when workers are at risk will be increasingly critical as Australia’s climate continues to warm.

    How can the index be used?

    The Heat-Related Workforce Injury Risk Index is designed as a practical decision-support tool.

    Organisation typeHow the index can help
    Workers’ compensation schemes
  • Identify regions and employer groups where claim frequency may be sensitive to rising temperatures
  • Support analytical insights into emerging heat risk drivers and sustainability analysis
  • Enable informed discussions with employers and industry groups on heat-related risk.
  • Safe Work regulators
    and policymakers
  • A geographically granular view of occupational heat risk
  • Evidence to inform prevention campaigns and industry guidance
  • A data-driven foundation for understanding how climate change may reshape workplace injury risk profiles over time.
  • Self-insurers and
    large employers
  • Highlight sites and regions requiring enhanced heat management protocols
  • Assist with prioritisation of investments in heat risk reduction measures such as improved shade structures, ventilation upgrades, hydration programs, or shift redesign
  • Support targeted adoption of emerging heat management technologies, including wearable heat-strain monitoring devices or phase-change cooling vests.
  • The index supports targeted, proportionate action, directing attention and investment to when, where and who heat risk is most materially concentrated.

    Looking ahead

    As temperatures rise, areas considered low risk today may face greater heat exposure in the future. Changing workforce patterns — as industrial hubs grow, shift, or relocate — will further shape how and where workers experience heat stress. Understanding the evolving interaction between climate and occupational exposure will be key to managing future workforce risk.

    We’re continuing to refine and extend the Heat Risk Index to improve the evidence base. We welcome collaboration with schemes and employers interested in applying these insights.

    To learn what heat risk means for your organisation or portfolio, please connect with our team.