


As temperatures rise and heatwaves become more frequent, workplaces need to determine the risk of heat for their workers. Taylor Fry has developed the Heat-Related Workforce Injury Risk Index to provide a nationally consistent, region-level view of where extreme heat is most likely to translate into workplace injury risk across Australia. We reveal early results including which regions pose the highest risk and why.
In Australia, roughly 3,000 workers become ill or are injured at work every year due to heat, and that’s likely a significant undercount.
Australia has warmed every decade since the 1950s with extreme heat events becoming more frequent and intense. These conditions are projected to increase the incidence of heat-related illness and injury in occupational settings.
At the same time, heat is rising on the labour and workplace safety agenda around the world. Unions and health bodies are calling for stronger, clearer protections for workers against extreme heat. Regulators are reinforcing employer obligations to manage heat risk under existing WHS frameworks.
The direction of travel is clear: heat is a growing workplace hazard in Australia. For workers’ compensation schemes, self-insurers and regulators, this raises important questions:
- Where is heat most likely to drive increased claim frequency?
- Which regions and industries face structurally higher exposure?
- How might rising temperatures affect scheme sustainability over time?
- Where should prevention efforts be prioritised?
To help answer these questions, we developed the Heat-Related Workforce Injury Risk Index.
Introducing the Heat-Related Workforce Injury Risk Index
The index is a nationally consistent, region-level tool that maps where climatic heat stress and workforce exposure intersect to create elevated injury risk.
The index brings together three components:
1. Hazard – How often local conditions exceed safe working heat thresholds
We measure heat stress using Wet Bulb Globe Temperature (WBGT), the internationally recognised standard for occupational heat stress used by occupational health and safety experts globally. WBGT combines air temperature and humidity (as well as wind speed and solar radiation) to reflect how effectively the human body can cool itself through sweating. This is incorporated using BoM daily weather data.
2. Exposure – How many people are working in heat-exposed industries in that region
This is measured using “place of work” data, allowing us to map the daytime distribution of workers across industries and regions.
3. Vulnerability – The baseline injury risk profile of workers in each industry
Vulnerability reflects differences in underlying injury rates across industries, using national workers’ compensation data.
Who is feeling the heat?
Heat risk is not evenly distributed across Australia.
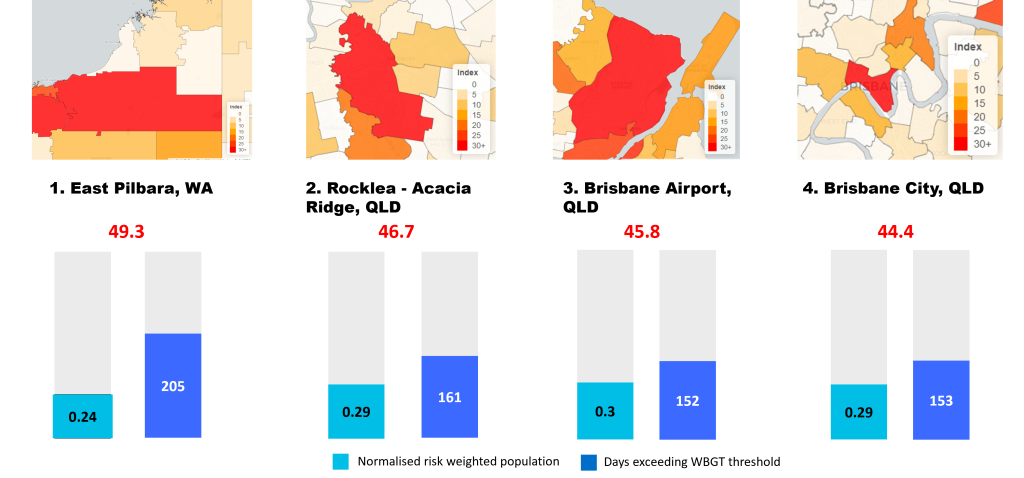
While most SA2 (Statistical Area Level 2) regions record low to moderate index values, a small number stand out dramatically – several regions record values more than 40x higher than the national median. These are areas where three factors converge:
- Prolonged periods of high WBGT are common
- Large concentrations of workers are employed in physically demanding or heat-exposed roles
- Baseline injury rates are already elevated.
The highest-risk region is East Pilbara in Western Australia. This region records around 200 days a year above the WBGT threshold, according to BoM data, and supports one of Australia’s largest mining workforces. Many workers are on a fly-in fly-out basis and may arrive from cooler climates, meaning they are often not fully acclimatised to local conditions, which heightens physiological strain.
Importantly, heat risk is not confined to remote regions that are traditionally associated with extreme temperatures. Industrial precincts on the edges of major cities also feature prominently.
For example, Rocklea–Acacia Ridge located within Brisbane’s industrial corridor has a dense concentration of transport, warehousing, logistics and manufacturing operations. High humidity, which is a critical driver of WBGT, combined with a large high-risk workforce materially increases exposure.
Other very high risk areas include:
- Brisbane Airport: Airport operations involve extensive outdoor or semi-outdoor activity on metal surfaces and large paved areas that radiate heat. Physical tasks such as baggage handling, ground operations and maintenance become significantly more demanding on high-WBGT days. In addition, workers are often required to wear high-visibility and specialised PPE, such as anti-static garments used around aviation fuels and oils, which are not always conducive to ventilation and cooling.
- Brisbane City: Even in a metropolitan CBD environment, workforce density and climate exposure can combine to produce elevated risk. Heat risk is not only about remote mine sites. It is also about how many people are working, what they are doing, and how often conditions exceed safe thresholds.
These results show heat risk extends beyond specific sectors, regions, or occupational groups traditionally associated with extreme temperatures. Developing a more nuanced and granular understanding of who, where, and when workers are at risk will be increasingly critical as Australia’s climate continues to warm.
How can the index be used?
The Heat-Related Workforce Injury Risk Index is designed as a practical decision-support tool.
| Organisation type | How the index can help |
|---|---|
| Workers’ compensation schemes | |
| Safe Work regulators and policymakers | |
| Self-insurers and large employers |
The index supports targeted, proportionate action, directing attention and investment to when, where and who heat risk is most materially concentrated.
Looking ahead
As temperatures rise, areas considered low risk today may face greater heat exposure in the future. Changing workforce patterns — as industrial hubs grow, shift, or relocate — will further shape how and where workers experience heat stress. Understanding the evolving interaction between climate and occupational exposure will be key to managing future workforce risk.
We’re continuing to refine and extend the Heat Risk Index to improve the evidence base. We welcome collaboration with schemes and employers interested in applying these insights.
To learn what heat risk means for your organisation or portfolio, please connect with our team.