









People experience homelessness in very different ways, from sleeping rough to families living in overcrowded housing. Capturing those experiences in data is far from straightforward and good policy depends on good evidence. When it comes to homelessness, no single dataset can provide a complete picture. The challenge is not finding one perfect measure, but understanding how different sources can work together to inform better decisions.
Homelessness is an important social challenge, but is one of the hardest to measure. Alongside the recent Census night in Australia there was discussion about the Census’s role in providing the information needed to design services to meet people’s needs. It’s a valuable data source on many topics, including homelessness. However, the complexities of measuring homelessness mean there is value in considering multiple data sources. Administrative data, street counts, and longitudinal studies can all complement the Census in important ways. The input of people working in, and affected by, the homelessness support system is crucial to helping interpret these sources.
Why homelessness is hard to count
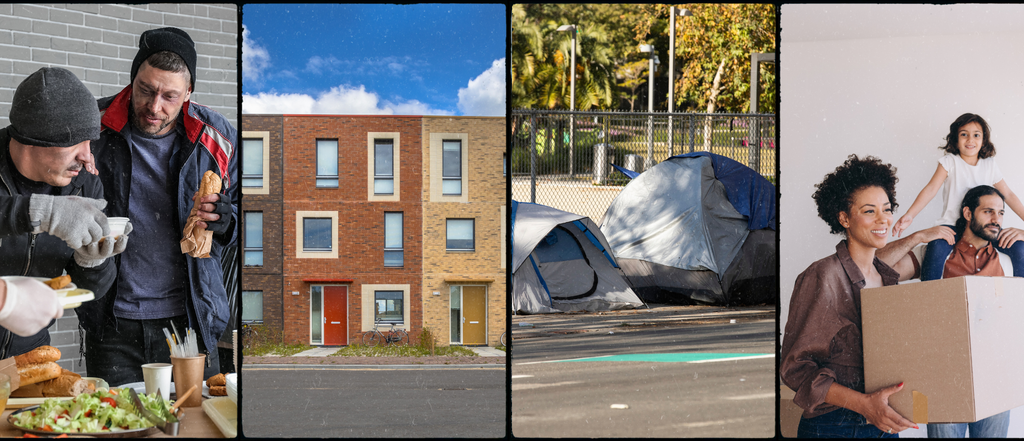
Quantifying homelessness is challenging. Measurement requires first defining what circumstances constitute homelessness, and there is no single definition. There is also no single experience of homelessness. While many people think of homelessness as sleeping rough (a tricky group to count in its own right), modern definitions are broader to include other forms of precarious housing such as crisis accommodation, boarding houses, overcrowded dwellings and temporary stays with family or friends.
Further, people experiencing homelessness may move frequently between different settings. Stigma, safety concerns and limited contact with services can also make people less visible in official records.
Understanding different forms of homelessness is challenging but important for policy. A person sleeping outdoors may need a different response from a family living in severe overcrowding, even though both lack secure and adequate housing.
Different measures tell different stories
In Australia we use several sources to understand homelessness, and they’re all distinct:
- The ABS Census estimates the population experiencing homelessness on a particular night. The definition used is fairly broad, including forms of hidden homelessness, such as severe overcrowding and temporarily staying with other households.
- Specialist Homelessness Services (SHS) data records people receiving support, or seeking support, often across a year or other time period. Importantly, SHS assist people who are currently homeless, but also people who are at risk of homelessness, meaning the assisted population is potentially larger than other counts. It does not capture people who may not seek support through these services.
- Street counts focus mainly on visible rough sleeping in selected locations, and so only capture a narrow subset. By-name lists are also used to support local coordination and similarly capture a subset.
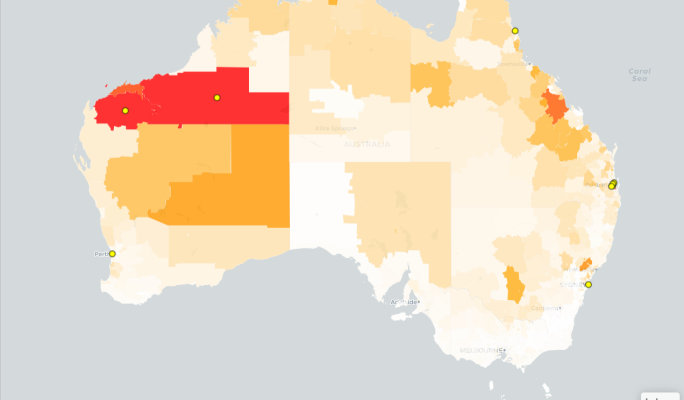
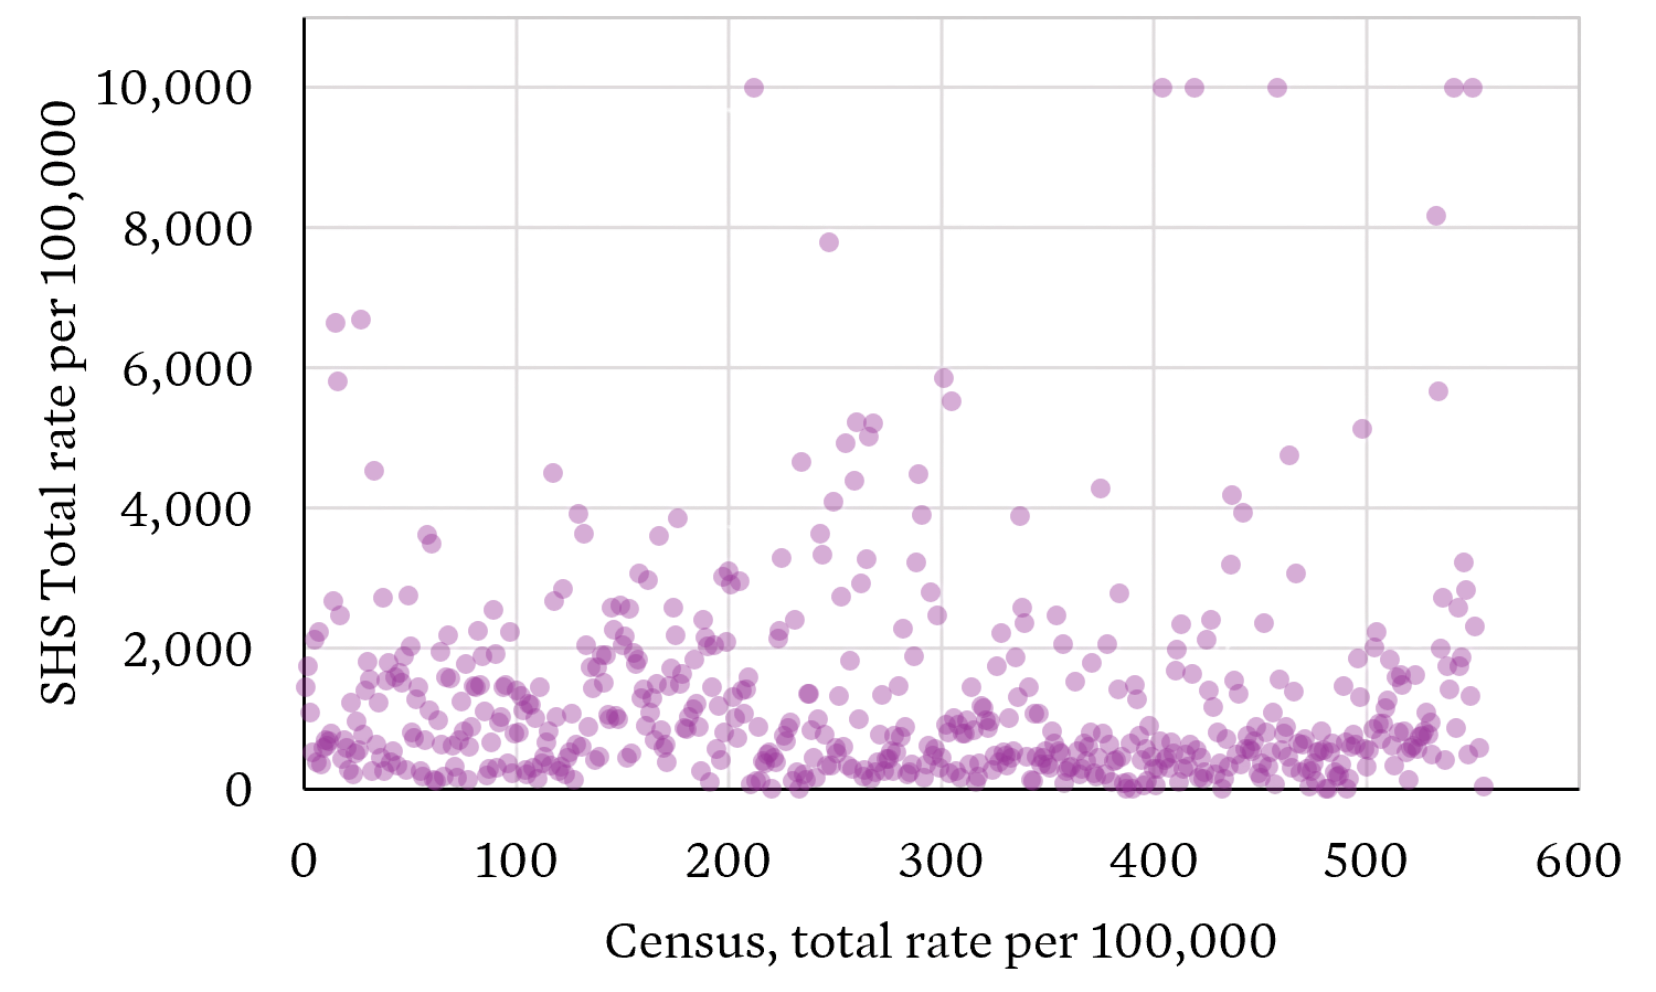
These measures cannot be expected to match. They use different definitions and consider different time periods. Even when we look across Local Government Areas (LGAs) we see large mismatches in what the different sources tell us. The per capita LGA-level rates show little correlation.
Comparison of LGA-level homelessness rates per 100,000 people based on 2021 census and SHS clients over 2020-21 (capped at 10,000)
What the Census captures
The ABS Census remains Australia’s most comprehensive basis for estimating homelessness because it aims to count the whole population, not only people who access services.
The 2021 Census estimated 122,494 people were experiencing homelessness on Census night . The estimate covers six operational groups, including people sleeping out or living in improvised dwellings, supported accommodation, temporary stays with other households, boarding houses, other temporary lodgings and severely crowded dwellings. The definition is based adequacy of dwelling, tenure and space for social relations.
It’s important to note this definition could still be considered narrow, for example it excludes people classified as marginally housed, such as paying rent to live long-term in caravan parks or residential parks with basic amenities.
Alternative definitions are used elsewhere, including New Zealand, which uses the concept of severe housing deprivation (or lack of access to minimally adequate housing). This consists of four categories: people without shelter, people in temporary accommodation, people sharing accommodation (couch surfing) and people in uninhabitable housing. The measurement of severe housing deprivation primarily uses the Stats NZ Census data with some supplements from providers and administrative data. To determine if individuals are in inadequate housing due to material deprivation, measures of family structure and income are derived from Census responses.
No measure is perfect, the Census is conducted only every five years, it provides one point-in-time snapshot and can undercount people whose circumstances make enumeration difficult.
The 2021 results also reflected the unusual accommodation and movement conditions of the COVID-19 pandemic. The 2026 Census results will provide an important update, there are many reasons to think homelessness may have increased with:
- Pressures in the rental market – Rent increases have far outstripped wages growth, and rental vacancies have been at historically low levels
- The cost-of-living crisis – We have experienced periods of high inflation adding further pressure on people struggling to pay rent
- Family and domestic violence – Domestic and family violence remains a key driver of homelessness and has increased, at least in some states
- Stakeholders across Australia reporting increases in homelessness.
SHS data is also valuable
Administrative SHS data complements the Census in important ways. The data is collected continuously and so updates are available frequently. It contains homelessness-specific information about clients’ circumstances, needs and assistance. It also allows tracking of repeated service use over time, allowing refined measures, such as persistent homelessness among SHS clients, which can reveal patterns a single-night count cannot.
However, SHS data also carries large limitations. It does not capture everyone experiencing homelessness. People may not seek assistance, may be ineligible, may face cultural or practical barriers, or may live where suitable services are unavailable.
Crucially, SHS client numbers and services are also shaped by supply. Funding, workforce capacity, eligibility rules, referral practices and geographic coverage affect how many people a service can assist and therefore how many appear in the data. If funding expands, recorded client numbers may rise because more need can be recognised and met. If capacity is constrained, apparently stable client numbers may coexist with increasing homelessness and unmet demand. As an example of how funding influences consider the different picture given by homelessness clients per capita in Queensland, NSW and Victoria alongside expenditure as per the Report on Government Services 2026.
Recent trends in clients and expenditure per captia in selected states
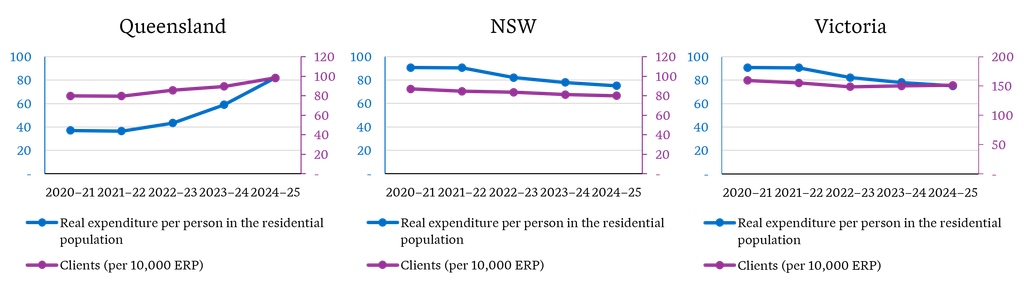
This creates an important interpretation issue. A service-use trend is partly a measure of government and community-sector response, not simply a measure of underlying homelessness. SHS data is therefore indispensable for understanding demand, pathways, support and outcomes, but it should not be used alone to estimate the prevalence of homelessness.
New Zealand’s move away from Census data
New Zealand’s Census modernisation makes this distinction especially relevant. Stats NZ is moving away from traditional Censuses and towards an administrative-data-first census, supported by surveys. The approach is intended to rely more on information already collected by government and other organisations, while surveys remain important for validation and for information missing from those records.
Homelessness is a demanding test case. The 2023 estimate of rates of severe housing deprivation in New Zealand combined Census variables and improved collection strategies to estimate people living without shelter, in temporary accommodation, sharing accommodation or in uninhabitable housing. Stats NZ described these as the best point-in-time estimates available, while acknowledging likely undercounting and a substantial group whose status could not be determined.
An administrative data first model may improve timeliness, but it also risks making people visible only through their contact with government systems. The New Zealand approach therefore reinforces the need for surveys, tailored enumeration and transparent assessment of coverage gaps.
No single measure is enough
The Census provides the best national estimate of how many people are experiencing homelessness at a point in time, while SHS data provides more timely insights into service demand, client needs and pathways through homelessness. Neither source on its own can provide a complete picture.
An evidence-informed approach to policy needs insights from multiple sources. National datasets can be complemented by longitudinal studies and linked administrative data studies. For example:
- Journeys Home provide insights into people’s experiences and pathways into and out of homelessness
- Evaluations of the Aspire Social Impact Bond in South Australia and Housing First programs in New Zealand help us understand longer-term outcomes
- Our work examining cross-sectoral pathways prior to homelessness in NSW can help identify earlier intervention points across service systems.
We can also consider proxy indicators, for example social and affordable housing rates, social housing waitlists, rental market indicators as is done by Homelessness NSW. And we need to supplement quantitative analysis with the input of people working in, and affected by, the homelessness support system.
Ultimately, measuring homelessness is not simply a statistical challenge. Better data leads to better policy, better targeting of services and a stronger understanding of what works. As homelessness pressures evolve, Australia will need to continue investing not only in data collection, but also in monitoring, evaluation and data linkage so long-term impacts of programs and policies can be understood and improved over time.